By Monica Nahabwe , Lead Quantitative Researcher, WeResearhit Partners
The Crisis We Breathe
Air pollution is no longer an invisible threat in Kampala—it’s a visible crisis. The city’s skyline may gleam with progress, but five Ugandans die every day due to air pollution-related illnesses (Saturday Monitor, Feb 2025). The invisible culprit? PM2.5 — tiny airborne particles that penetrate deep into the lungs and bloodstream, causing heart disease, strokes, and respiratory infections.
At WeResearchIt Partners, we analysed satellite-derived PM2.5 data from the CAMS Global Reanalysis System for the Greater Kampala Metropolitan Area (GKMA), which includes Kampala, Mukono, and Wakiso. Using Python-based modelling and WHO thresholds, we visualised air quality trends to understand when Kampala’s air is safest and most hazardous.
Our mission:
- 📊 Quantify PM₂.₅ levels
- 🕑 Identify when and how people are most exposed
- 🛡️ Evaluate health risks
- 🛠️ Recommend actionable, local interventions
What is PM2.5 and Why Should We Care?
PM2.5 refers to airborne particles smaller than 2.5 micrometres—invisible, but deadly. According to the World Health Organisation (WHO):
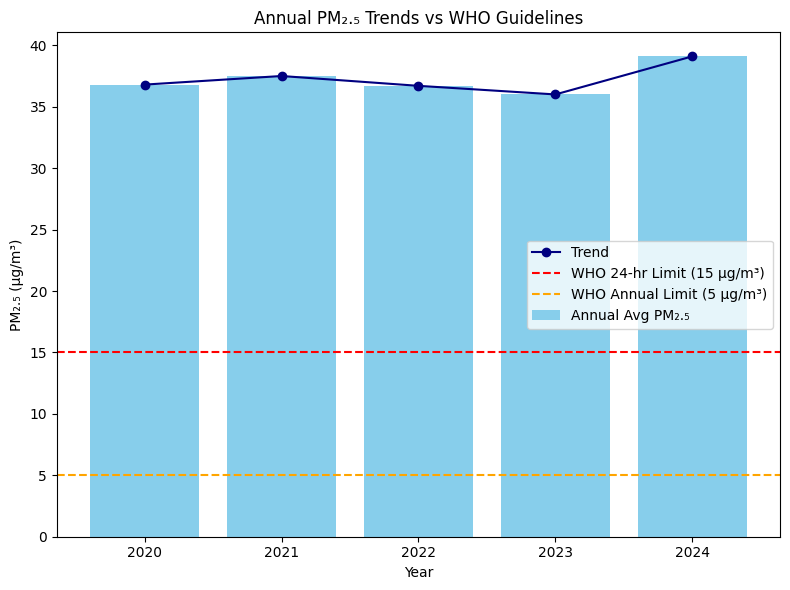
- Annual average PM2.5 should not exceed 5 µg/m³
- 24-hour exposure should not exceed 15 µg/m³ more than 3–4 days per year
Unfortunately, Kampala consistently exceeds both thresholds, with major public health consequences.
Annual pm25 averages exceed WHO limits by over 7 times
From 2020 to 2024, annual average PM2.5 levels have remained above 36 µg/m³, more than 7x the WHO guideline. This points to chronic, year-round exposure.
What does the Data Tell us?
1. Early Morning Danger Zone
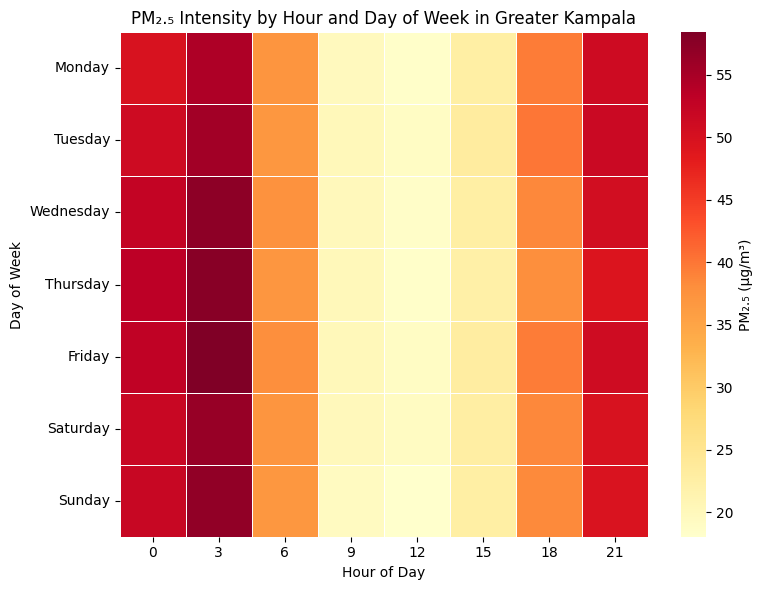
Highest concentrations occur around 00:00 and 03:00, exceeding safe WHO limits by 2–3 times. This is especially harmful to children, the elderly, and those with respiratory issues.
2. Midday Relief
Pollution levels are lowest from 09:00 to 15:00, with the cleanest air typically around noon. Still above WHO levels, but comparatively safer for outdoor activity.
3. Evening Pollution Uptick
Between 18:00 and 21:00, PM2.5 spikes again—likely due to:
- Evening traffic
- Biomass cooking
- Reduced atmospheric dispersion
4. Minimal Weekday Variation
Pollution levels remain consistent across weekdays. However, Wednesday to Friday show slightly higher early-morning peaks, suggesting industrial or commuter traffic influence.
When Kampala Breathes Easier
Cleanest Hours: 09:00–15:00
While still exceeding WHO limits, this period consistently shows lower PM2.5 levels, making it the safest window for vulnerable populations to be outdoors.
Dry Season Spikes (Jan–Mar)
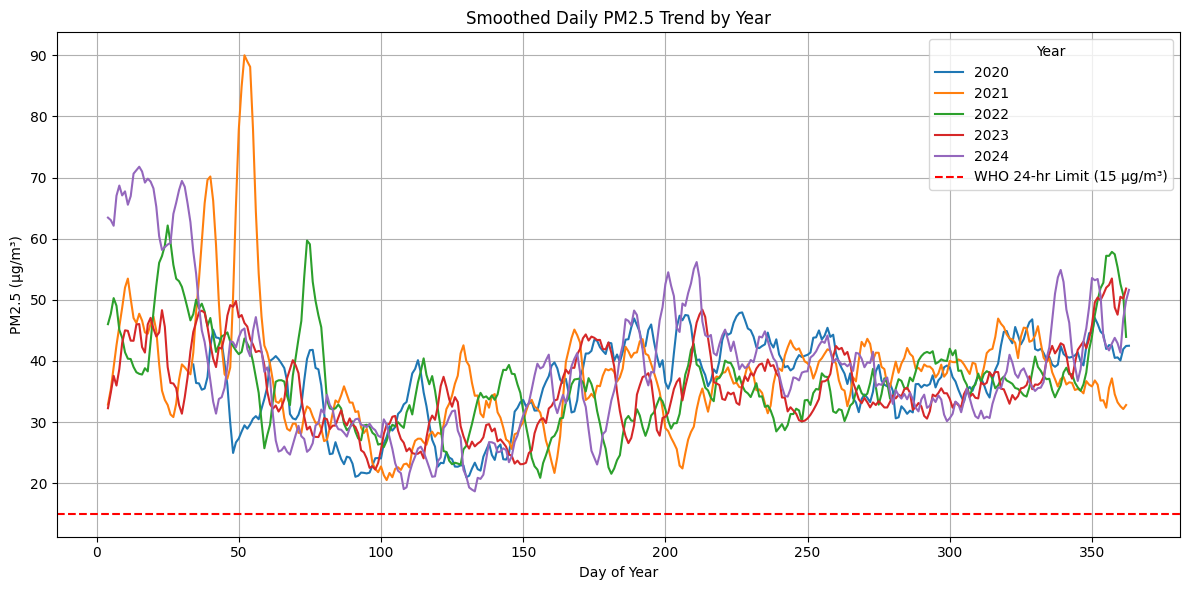
Every year, air pollution peaks in the first quarter, particularly in January and February. These spikes might be driven by:
- Open waste and biomass burning
- High vehicular emissions
- Dust from unpaved roads and dry weather
In 2021 and 2024, PM2.5 levels surged above 90 µg/m³, nearly 6x the daily WHO guideline. This makes the early-year period especially hazardous.
Rainy Season Relief (May–Aug)
All five years show a noticeable mid-year dip in pollution, with levels dropping during the rainy season. This is likely due to:
- Rain removing particulate matter from the air
- Reduced use of open fires for cooking and waste disposal
- Less dust circulation
However, even during these months, PM2.5 levels remain above WHO thresholds—just less severely so.
No Improvement Over Time
Despite growing awareness, there is no evidence of progress. Later years, particularly 2023 and 2024, demonstrate more extreme early-year spikes.
- The lack of year-on-year improvement suggests that policy action has been limited or ineffective.
- The consistency of high pollution confirms that air quality challenges are chronic, not episodic.
How Often Are We Breathing Unsafe Air?
If you stepped outside in Kampala on any random day in the last five years, the odds were overwhelmingly against you breathing clean air. The analysis below is of over 1,800 daily PM₂.₅ readingsfrom 2020 to 2024 categorised using WHO’s Air Quality Index (AQI) benchmarks.
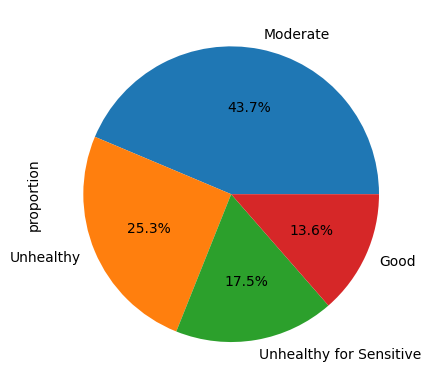
- Only 13.6% of days met the WHO’s safe air quality limit of 15 µg/m³ – That’s just 1 in 7 days offering air that meets international health standards.
- 43.7% of days fell into the moderate pollutionrange
- 17.5% of days were labeled “Unhealthy for Sensitive Groups” – On these days, people with asthma, heart conditions, pregnant women, and the elderly were especially at risk.
- 25.3% of days were “Unhealthy for Everyone” – That’s over 90 days a year when the entire population faced dangerous air quality, regardless of age or health status.
Kampala residents breath unhealthy air on more than 310 days per year.
What Can Be Done? A Data-Driven Action Plan
At WeReserchit, we believe that not all is lost this is a solvable crisis. Cities around the world have reversed air pollution trends. Kampala can too—with:
- 🔥 Bans on open burning
- 🚍 Low-emission transport zones
- 🌳 Urban green buffers
- 📡 Real-time pollution monitoring & public alerts
But we must move from data blindness to data action.
Let’s Work Together to Clean Kampala’s Air—and Cities Across Africa
At WeResearchIt Partners, we turn African data into insights—insights that drive cleaner air, healthier cities, and more informed public policy.
Using open-access satellite data, Python-based modelling, and machine learning, we work to:
- Generating historical and predictive insightsfrom satellite-derived PM₂.₅ data
- Deliver real-time air quality alertsto protect the public
- Support evidence-based urban policy across African cities
Are you:
- A city leader seeking actionable environmental insights?
- A donor agency or NGO funding clean air or health initiatives?
- A researcher or journalist in need of real-time local insights?
We’d love to collaborate. Let’s transform raw environmental data into tools that protect lives and shape the future.
📬 Contact Us
Monica Nahabwe 📧 nmonica@weresearchitpartners.com 🌐 www.weresearchit.org
#KampalaAirQuality #AirPollution #CleanAir #DataForDevelopment #WeResearchIt #ClimateJustice #AfricaResearch #PM25 #UrbanHealth #SustainableCities


